Financial Strategy and Performance
Increasing Corporate Value and Pre-financial Indicators
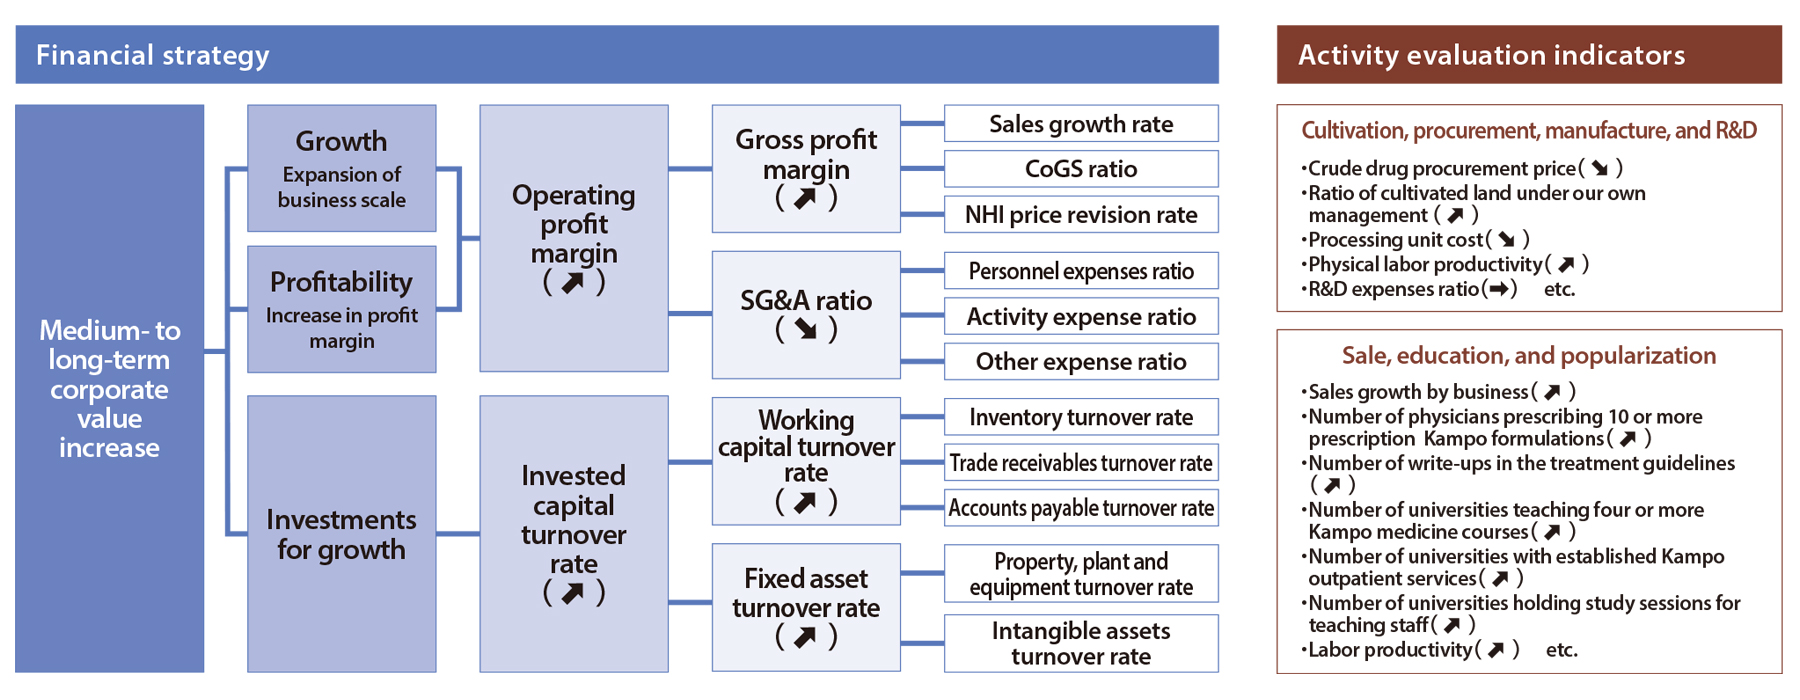
As a financial strategy for increasing our corporate value over the medium to long term, we are managing action evaluation indicators in our Kampo value chain, aiming to expand our business scale, increase profit margin, and invest for growth. In cultivation, procurement, manufacture, and R&D, we aim to reduce the purchase price of crude drugs by expanding the ratio of cultivated land under our own management and promoting cultivation of wild crude drugs. In addition, we will see efficiency increase with growth in production volume following the expansion of the Kampo market, and we will also increase the labor equipment ratio through the adoption of AI and robotics, including the introduction of automated crude-drug sorting machines with AI. We aim to reduce processing costs by using and enhancing big data pertaining to manufacturing and quality to realize smart factories. We will maintain R&D investment at 5% or higher of net sales, investing heavily and giving priority to areas such as new disease, promoting personalization of Kampo treatment, and pre-symptomatic disease. In the areas of sale, education and popularization, we are working to expand standardization of Kampo treatment by increasing the number of physicians prescribing 10 or more prescription Kampo formulations and by increasing the number of write-ups in the treatment guidelines. We will also work to personalize medicine and to take on the challenge of pre-symptomatic diseases. Moreover, we will support Kampo medicine education, so that it is a required subject in all university medical departments, Kampo outpatient services are established, and study sessions for teaching staff development are held to enable them to give instructions in Kampo medicine. In the China business, we will work on business expansion towards achieving an overseas sales ratio of 50% or higher.
- Pre-financial assets: assets that are to be turned into realized financial assets and are as important as financial assets For the purpose of the Tsumura Group, we use the term “pre-financial” for what is commonly referred to as “non-financial” in the business sector.
Net sales and operating profit
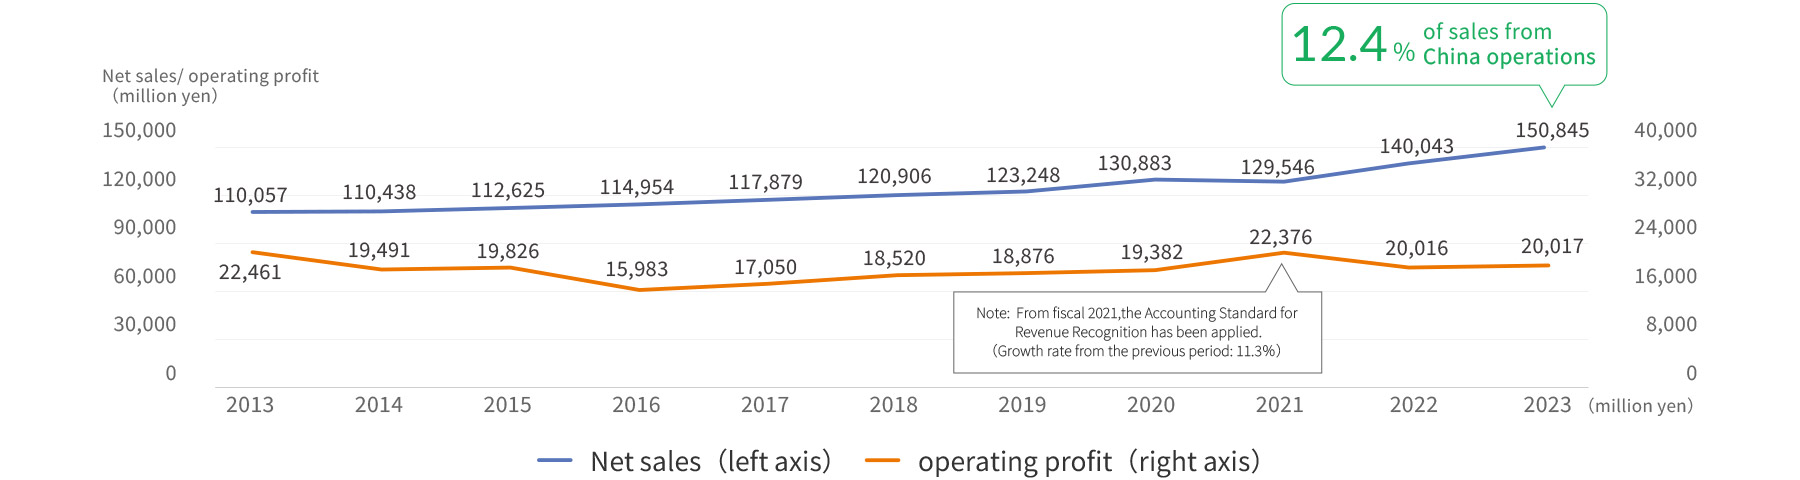
The above chart shows the trend of net sales and operating profit.
In order to increase net sales (expansion and stable growth of the Kampo market), we focus on the following areas, and sales are continuing to increase.
Provide ongoing support to enhance, establish and develop functions for providing long-term Kampo medicine education for students, trainee physicians and experienced practitioners.
Build basic and clinical evidence centering on drug-fostering program formulations (listing in treatment guidelines, standardization of Kampo treatment)
Increase the percentage of physicians prescribing 10 or more prescription Kampo formulations to 50%
To boost profitability (cost structure reform), we address strategic issues facing each of the following areas related to procurement, manufacturing and sales, aiming to realize the related visions.
Procurement: expand cultivated land under the Group’s own management* in order to stabilize the prices of raw material crude drugs and optimize the inventory volume and turnover of crude drugs
Manufacturing: increase production capacity and introduce new production technologies to promote robotic process automation
Sales: minimize the impact of drug price revisions (ongoing promotion of the product value of prescription Kampo formulations)
- Cultivated land under own management:Cultivated land for which the Group is entitled to give direct cultivation instructions, monitor cultivation costs, and set purchase prices of crude drugs based on the monitoring data
Pre-financial data
Expanding cultivated land under the Group’s own management
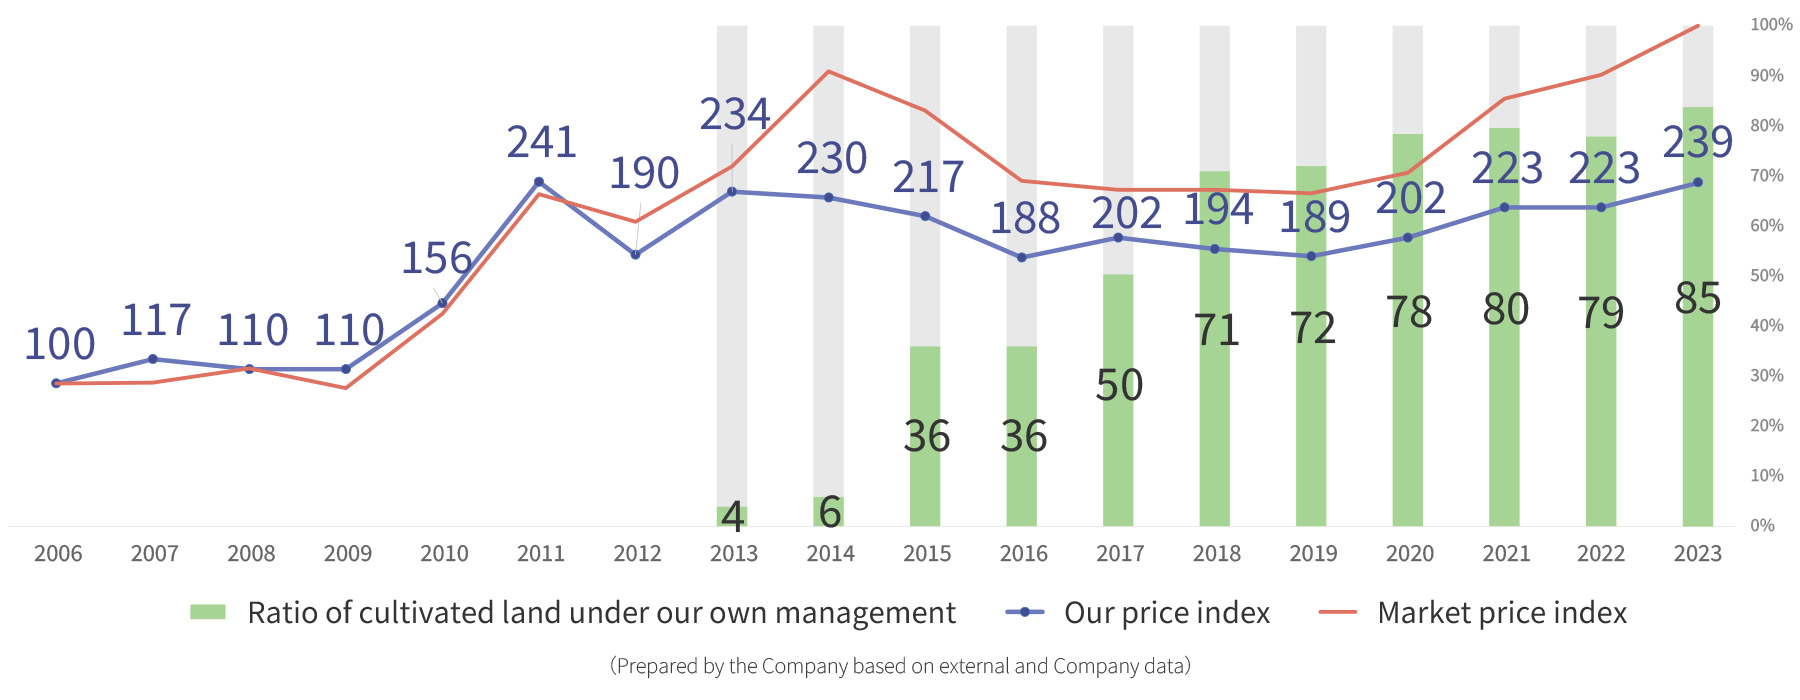
As a measure to procure high-quality crude drugs stably and for better-than-market prices, we are striving to expand cultivated land under our own management, and the percentage of crude drug procurement from land under management has risen to over 80%.
By managing the entire process from cultivation and procurement of crude drugs used as raw materials for Kampo formulations through to manufacturing and sale of extract formulations, we are able to provide a stable, efficient supply of high-quality Kampo formulations, which is a tremendous source of competitive advantage.
Going forward, we will work on increasing the acreage under cultivation as well as variety of target species in response to the growing China business.
- Tsumura’s price index: weighted average prices calculated based on the amount used by the Group (100: FY2006)
Increase production capacity and introduce new production technologies
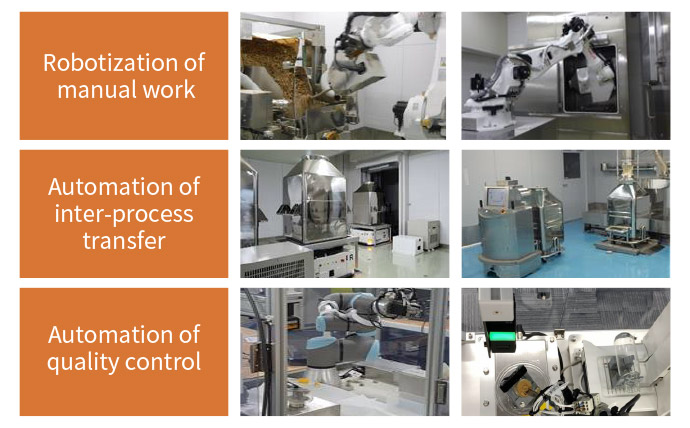
We have adopted robotic technologies to implement robotic process automation for the whole manufacturing process, while increasing production capacity in a phased manner at the same time.
We also pursue automation of the crude drug sorting operation, an upstream process in the Kampo value chain, which deals with plant roots and stems that have non-uniform size, shape, and mass. Previously, this posed a significant challenge for us to automate the process, giving us no other choice but the visual sorting method. To address this challenge, in 2018 we started developing an automated sorting machine powered by AI. In 2022, the first model was introduced to the Ishioka Center to be given a trial run.
Going forward, we plan to roll out the developed machine to other sites, looking to establish low-cost operations while shifting staff freed from the task of visual sorting to more productive work.
Age/gender ratio of Kampo medications administered
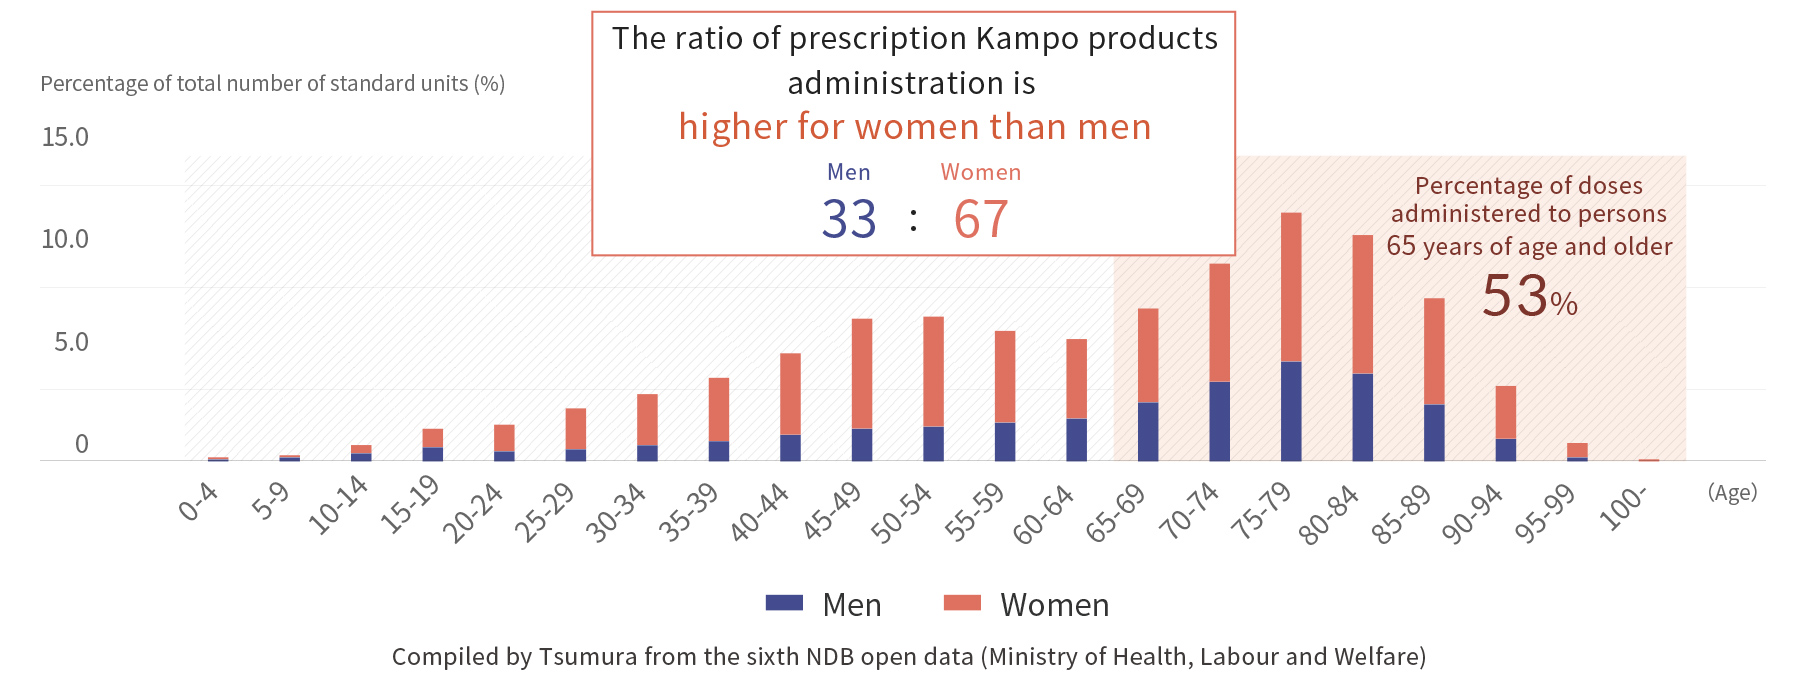
Seniors and women are major users of prescription Kampo formulations. In particular, women users span all age groups.
Prescription Kampo formulations are provided at almost all clinic departments, most notably at obstetrics/gynecology and psychiatry, where more than 90% of physicians prescribe Kampo.*
- Source: 2011 Survey on the Status of Kampo Prescriptions, published by the Japan Kampo Medicines Manufacturers Association
Dividends(JPY)and Dividend on equity ratio
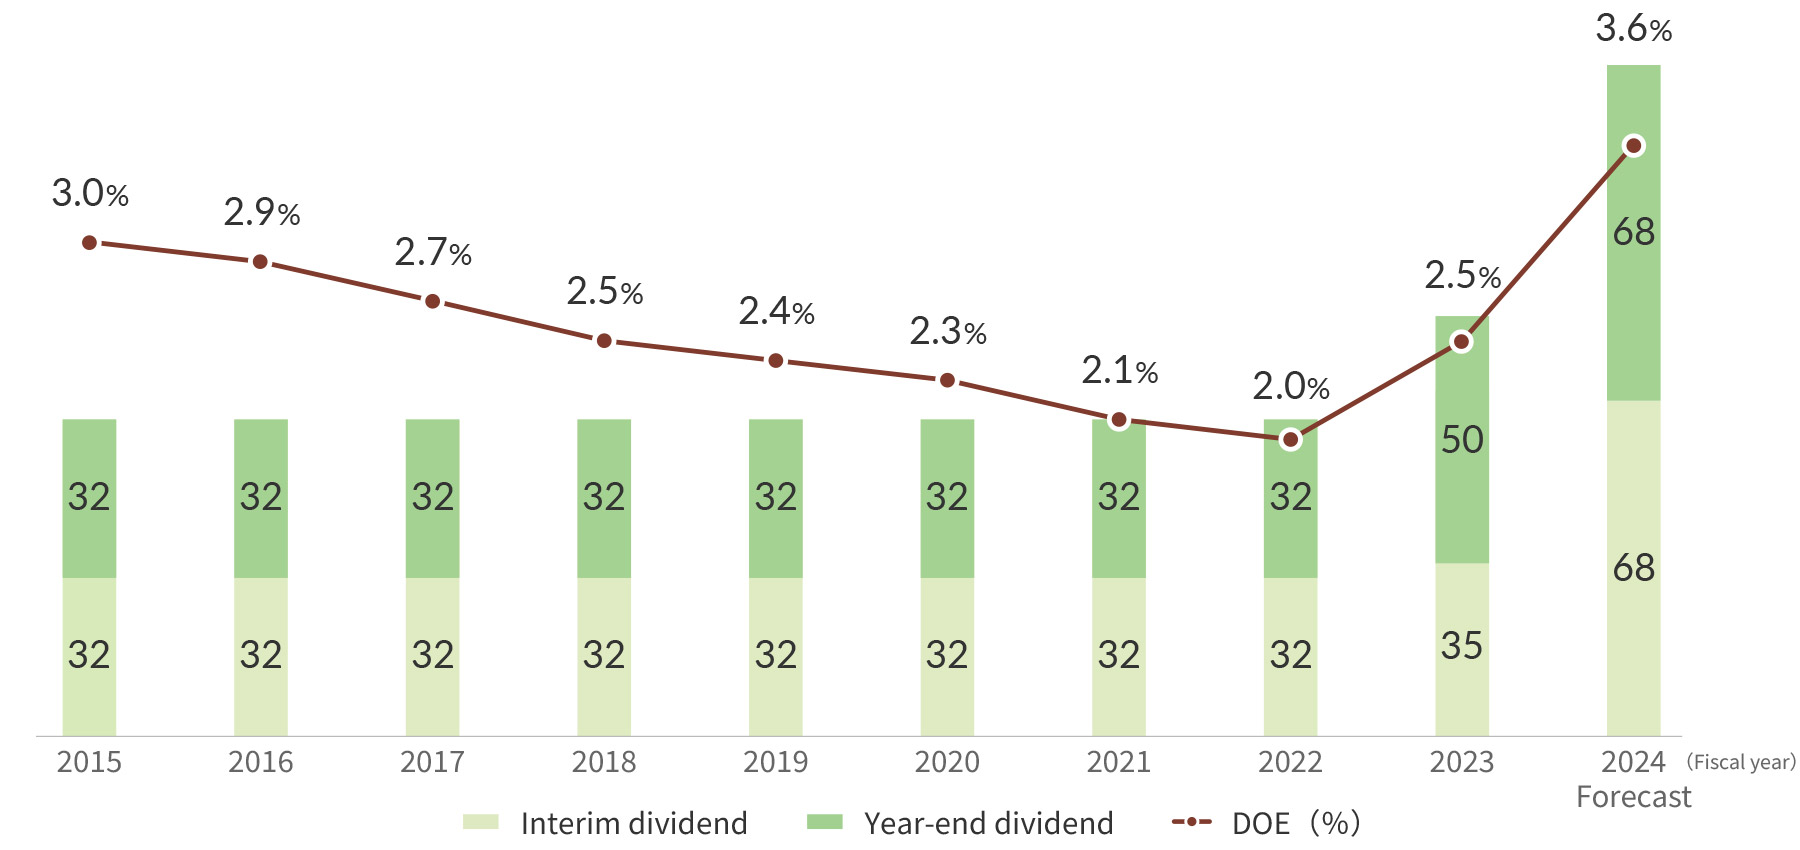
Tsumura considers returning profits to shareholders as an important policy, and has recently revised its shareholder return policy partially as part of efforts to improve corporate value over the medium to long term through the realization of TSUMURA VISION “Cho-WA” 2031.
We aim to increase dividend yields while maintaining a sound balance sheet, setting the dividend on equity (DOE) ratio as a key indicator.
We have set a DOE of 5% as the target for FY2031.
- Reference:Notice Concerning Revision of Basic Capital Management Policy and Shareholder Return Policy and Revision of Dividends Projection (Dividend Increase) https://www.tsumura.co.jp/newsroom/item/20231107.pdf
List of other pre-financial data
For other pre-financial data, please refer to the following.